Stoyan Stefanov recently posted a fantastic set of slides on pitching better website performance. The slides look at different websites and how performance affected the core business. It's a cool idea. I think material like this is useful for a variety of reasons, but most of all because it provides insights into how I can better transform my technical work into something that talks about business value. Each slide is a mini case study on looking at a company and translating performance into a business driver important to them. As testers, we need to be good at that. The more exposure we get to materials like this, the easier it becomes to recognize similar opportunities in our own organizations.
Following up on yesterday's post, another tool from Stoyan Stefanov's recent post on performance testing tools is PageTest. From the Stoyan's post:
For some other cool tools, checkout Stoyan's full post.
"AOL's PageTest is an IE plugin but also a hosted service which is a great way to show your boss/client performance details without inconveniencing them with challenging download and installation activities. PageTest gives you a waterfall view of the page load and a checklist of things to improve, plus some screenshots of interesting moments during load and even a video - an excellent view of how the page looks like in slow speeds. The hosted service can show you the dial-up experience in 4 different places in the world.
For some other cool tools, checkout Stoyan's full post.
 Stoyan Stefanov recently did a post on performance testing tools. In that post, he mentioned Yahoo! YSlow. From the YSlow website:
"YSlow analyzes web pages and suggests ways to improve their performance based on a set of rules for high performance web pages. YSlow is a Firefox add-on integrated with the Firebug web development tool. YSlow grades web page based on one of three predefined ruleset or a user-defined ruleset. It offers suggestions for improving the page's performance, summarizes the page's components, displays statistics about the page, and provides tools for performance analysis, including Smush.it™ and JSLint."
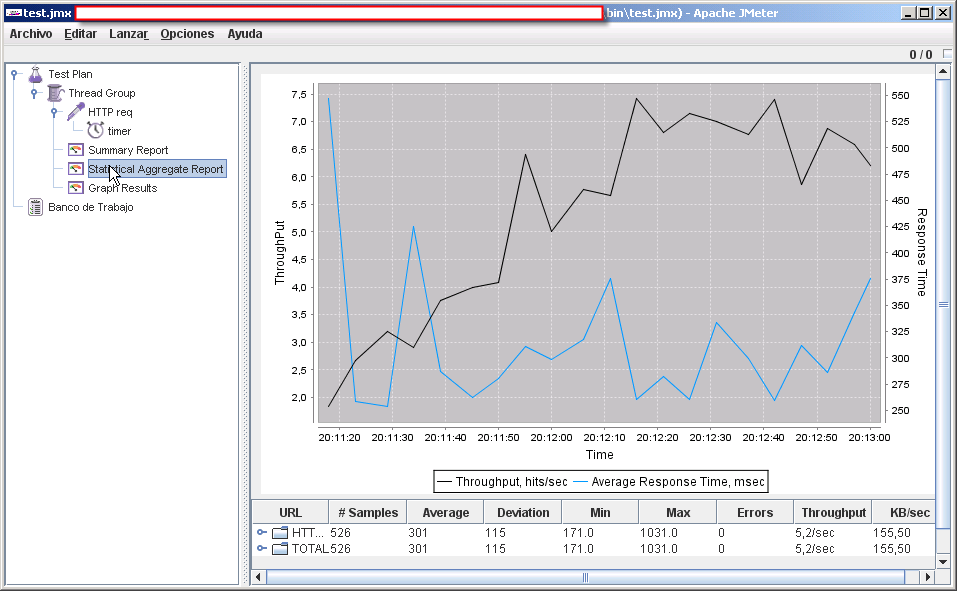
 If you're a regular JMeter user, you might be interested in taking a look at the Statistical Aggregate Report listener. The Statistical Aggregate Report listener is a JMeter plugin that kinda combines the Graph Results listener and the Aggregate Report listener into one handy little chart.
At the moment I'm using Perfmon to gather information on an SQL server and application I'm testing.
To know what are the best counters to use, I headed over to this great post by Brent Ozar where he explains in detail what perfmon counters you need and how you setup them up.
Here's what he recommends:
Performance Monitor Counters for SQL Server Analysis
These are listed OBJECT first, then COUNTER
Of course, that's the easy part. The real difficulty is being able to parse the log file and know what to do with the data.
Thankfully, Brent describes how to format the results in excel. He also describes how to analyze the data, starting with the the CPU, then Memory and finally Disk Metrics.
Personally, I'm going to go to my client's DBA and ask them what he thinks of the data, as he knows what I'm testing. It's not in my clients best interest to spend excessive amounts of time analysing this type of data when some-one internally is able to do so far quicker.
To know what are the best counters to use, I headed over to this great post by Brent Ozar where he explains in detail what perfmon counters you need and how you setup them up.
Here's what he recommends:
Performance Monitor Counters for SQL Server Analysis
These are listed OBJECT first, then COUNTER
- Memory - Available MBytes
- Paging File - % Usage
- Physical Disk - % Disk Time
- Physical Disk - Avg. Disk Queue Length
- Physical Disk - Avg. Disk sec/Read
- Physical Disk - Avg. Disk sec/Write
- Physical Disk - Disk Reads/sec
- Physical Disk - Disk Writes/sec
- Processor - % Processor Time
- SQLServer:Buffer Manager - Buffer cache hit ratio
- SQLServer:Buffer Manager - Page life expectancy
- SQLServer:General Statistics - User Connections
- SQLServer:Memory Manager - Memory Grants Pending
- System - Processor Queue Length
Of course, that's the easy part. The real difficulty is being able to parse the log file and know what to do with the data.
Thankfully, Brent describes how to format the results in excel. He also describes how to analyze the data, starting with the the CPU, then Memory and finally Disk Metrics.
Personally, I'm going to go to my client's DBA and ask them what he thinks of the data, as he knows what I'm testing. It's not in my clients best interest to spend excessive amounts of time analysing this type of data when some-one internally is able to do so far quicker.